The Maturity Arc: From InfrastructureMonitoring to AI Observability
There is a question every engineer eventually asks — usually at 2 a.m., usually during an incident, usually with a cold coffee and a dozen browser tabs open — that reveals everything about the state of their organization’s observability practice:
“Why is this broken, and how long has it been broken?”
The answer to that question — the speed of it, the precision of it, the confidence of it — is the single most accurate predictor of engineering maturity I know. Organizations that answer it in minutes have built something rare. Organizations that answer it in days, or never, are operating in the dark. And the dark, it turns out, has a very specific shape. It is not uniform. It has layers — six of them, stacked in historical sequence — and understanding those layers is understanding how the entire discipline of production visibility evolved from a blinking green light on a server rack to the frontier of reasoning about systems that reason.
This is that story. Six disciplines. Six evolutionary leaps. One relentless, uncomfortable truth: we have always known less than we thought we did.
The Shape of the Problem
Before tracing the arc, it is worth naming the underlying structure. Every discipline in this sequence was born from the same mechanism: a new architectural paradigm revealed a blind spot in the existing measurement philosophy, and the blind spot was expensive enough — in downtime, in user frustration, in engineering hours — that the industry was forced to build new instruments to see into it.
The pattern is recursive. Each set of instruments exposes a new category of failure that the instruments themselves cannot explain. That gap becomes the founding problem of the next discipline. And so the arc extends — not because engineers are careless, but because the systems they are building are genuinely, structurally harder to understand than the systems that came before them.
| # | Discipline | The Blind Spot It Filled | The Blind Spot It Created |
|---|---|---|---|
| 01 | Infrastructure Monitoring | Is the machine alive? | Is the app on the machine working? |
| 02 | APM | Where is the slowdown in my code? | What is the user actually experiencing? |
| 03 | Synthetic Monitoring | Can I detect failure before users do? | What about users not following the script? |
| 04 | Real User Monitoring | What do real users actually experience? | Why does the backend cause that experience? |
| 05 | Observability | Can I ask questions I didn’t pre-define? | Can I observe systems that don’t have deterministic outputs? |
| 06 | AI Observability | How do I debug a model, not just a service? | Still being written. |
01 — Infrastructure Monitoring
The question: Is the machine alive?
It started with a ping. Literally. The first monitoring system any networked organization ever ran was a script that sent an ICMP echo request to a server and waited. If the reply came back, the world was fine. If it didn’t, someone’s pager screamed. The entire philosophy of production visibility, in its earliest form, was binary: up or down. On or off. Green or red.
This was not laziness. It was honest epistemology. In an era of physical servers with fixed IP addresses and predictable workloads, the most operationally dangerous thing that could happen was hardware failure. SNMP — the Simple Network Management Protocol — extended this into the first genuine telemetry layer: you could now ask a device not just “are you alive?” but “how alive are you?” CPU load. Memory consumption. Network interface throughput. Disk I/O. Tools like Nagios, Ganglia, and RRDtool transformed these signals into time-series graphs and threshold-based alerts, giving birth to the Network Operations Center — that cathedral of blinking dashboards and rotating pager schedules that became the institutional embodiment of this era.
“The NOC was not a monitoring system. It was a cultural artifact — the physical manifestation of the belief that production systems could be understood by watching enough gauges.”
Then virtualization arrived and the entire model collapsed. Virtual machines spun up and tore down in seconds. Kubernetes pods were ephemeral by design — they were never meant to have stable identities at all. A monitoring system built around a fixed inventory of named hosts with known IP addresses simply could not track a fleet that was reinventing itself every few minutes. Prometheus reimagined the architecture from first principles: instead of a central poller querying known hosts, a pull-based discovery model that found targets dynamically, tagged them with arbitrary labels, and enabled aggregation across any dimension at query time. The rigid hierarchy of datacenter → rack → host → service dissolved into a fluid, composable tagging model.
The cultural rupture was as significant as the technical one. DevOps and Site Reliability Engineering dissolved the wall between the people who wrote the software and the people who ran it. Infrastructure ownership moved upstream — into the hands of the engineers who understood what the infrastructure was supposed to do. Visibility stopped being a political negotiation and became an engineering discipline.
Today’s frontier is eBPF — the extended Berkeley Packet Filter — which instruments the Linux kernel itself, exposing network flows, syscall patterns, memory allocations, and CPU scheduling decisions at sub-microsecond precision without requiring any changes to the application code running above it. Tools like Cilium and Pixie make kernel-level telemetry a practical operational capability, not a research project. The infrastructure layer has never been more visible.
And yet. A server running at 15% CPU utilization with 40% memory headroom and clean network throughput can be generating entirely corrupted responses to every user request. The infrastructure is healthy. The application is broken. The monitoring system cannot tell the difference. This gap — between the health of the substrate and the health of the software — was the founding problem of the next discipline.
The Unresolved Tensions
▸ Cardinality explosion — tagging by customer_id, request_id, or build_sha causes combinatorial metric series blowup that breaks time-series databases and billing.
▸ The semantic gap — healthy infrastructure metrics are silent on application correctness. A server at 10% CPU can be producing 100% wrong answers.
▸ Ephemeral inventory — capacity planning for autoscaling environments is planning for a system that does not yet exist in a form you can measure.
02 — Application Performance Monitoring
The question: Where in my code is the slowdown?
APM originated in a place no one expected: the Java Virtual Machine. In the late 1990s and early 2000s, enterprise Java applications were notoriously difficult to optimize — the JVM’s dynamic compilation and garbage collection behavior made performance profiling a specialized art form. Vendors like Wily Technology and Compuware Dynatrace discovered that by instrumenting JVM bytecode at class-loading time — injecting timing probes into methods without touching source code — they could expose the performance anatomy of a running application in production, in real time, without halting it.
This was genuinely revolutionary. For the first time, you could see inside a running production system and ask: which method is slow? Which database query is executing 400 times per request? Which external service call is adding three seconds to every checkout? The application stopped being a black box and became a navigable map. Performance became a feature that could be measured, owned, and optimized.
Then microservices arrived and the map became useless. A single user request now might traverse twelve independently deployed services, four message queues, two caches, and a legacy SOAP endpoint before producing a response. An agent that could profile a single JVM process could tell you exactly what happened inside service A — but the three-second latency might have been caused by service G, which called service K, which was waiting on a database that service A’s agent had never heard of. The single-process profiler could see everything inside its boundary and nothing beyond it.
“A distributed trace does not merely record latency. It narrates causality — the precise chain of service calls, database queries, and cache lookups that constitutes the life of a single user request, told as a story with a beginning, middle, and cause of death.”
Google’s Dapper paper, published in 2010, described the conceptual breakthrough: a unique trace identifier assigned at the point of origin and propagated through every downstream service call as an HTTP header. Each service contributes a timing span to the trace. The spans are correlated into a causal tree — not a flat list of events, but a structured narrative of cause and effect. The latency is no longer a mystery; it has a location, a parent, and a duration. Zipkin and Jaeger made this open-source. OpenTelemetry made it universal.
OpenTelemetry — born from the merger of the OpenTracing and OpenCensus standards — is the most significant interoperability breakthrough in the observability industry’s history. It decouples instrumentation from backend analytics: instrument your code once with the OTel SDK, and route your traces, metrics, and logs to any compatible backend without re-instrumentation. The OTel Collector enables intelligent routing, enrichment, and sampling in the pipeline itself. The semantic conventions — standardized attribute naming for HTTP requests, database calls, messaging operations — make cross-service correlation possible without bespoke negotiation between teams.
The current frontier is continuous production profiling — tools like Grafana Pyroscope using eBPF statistical sampling to maintain always-on flame graphs of CPU time and memory allocations at line-level granularity, without the overhead that made traditional profiling a special-occasion event. Correlate a slow trace span with its corresponding profiling data and you can navigate from “this checkout took 8 seconds” to “line 247 of PaymentService.java” in a single click.
The Unresolved Tensions
▸ Instrumentation coverage — achieving meaningful OTel adoption across a polyglot microservice estate requires coordinated effort across dozens of teams. Gaps create uninspectable blind spots.
▸ Sampling bias — full-fidelity tracing at 100% sample rate is prohibitively expensive at scale. Sampling strategies systematically under-represent the rare, intermittent failures that are most critical to understand.
▸ The last mile — APM sees everything that happens on your servers. It is entirely blind to what happens between your server’s response and the pixel on the user’s screen.
03 — Synthetic Monitoring
The question: Can I detect failure before my users do?
Synthetic monitoring is the discipline of productive fiction. It asks: what if I could send a perfectly behaved user to my application, from anywhere in the world, at any time I choose, and measure exactly what they experience? The answer is that you can — not a real user, but a scripted one, a synthetic agent executing a predetermined journey with mechanical precision, reporting back with clinical accuracy.
The power of this fiction is not that it reflects reality. It explicitly does not. That is the point. By making user behavior deterministic and repeatable, synthetic monitoring creates a stable baseline — a signal uncorrupted by the noise of real-world device diversity, network variability, and user idiosyncrasy. When that signal degrades, something has actually changed in your application, not in the weather conditions of your user population.
The evolution from HTTP ping to full browser simulation was dramatic. Where a ping check asks “does this URL return 200?”, a modern Playwright-based synthetic transaction asks: can a user navigate to the homepage, click “Sign In,” enter credentials, complete the MFA flow, search for a product, add it to cart, enter a shipping address, and reach the order confirmation screen — all within an acceptable time budget, from Tokyo, São Paulo, and Frankfurt simultaneously? Failure at any step, from any location, fires an alert before any real user has encountered the problem.
“Synthetic monitoring imposes a productive fiction on a complex system: the fiction that user behavior is deterministic, repeatable, and geographically well-distributed. That fiction is precisely what makes it useful — and precisely what limits it.”
Contemporary platforms — Datadog Synthetics, Dynatrace Synthetic Monitoring, New Relic Synthetics — deploy lightweight execution agents across dozens of global edge locations, capable of emulating specific network conditions (2G throttling, mobile latency profiles), particular browser fingerprints, and authenticated user sessions using securely vaulted credentials. The emerging frontier is adaptive test generation: ML models trained on real user flow data that automatically propose synthetic scripts mirroring actual behavioral patterns — blurring the boundary between the scripted and the lived.
Some platforms now integrate synthetic probing with chaos engineering principles — injecting deliberate faults (simulated DNS failures, certificate expirations, upstream service degradations) to validate that the application’s resilience mechanisms perform as designed under controlled conditions, before discovering they don’t under uncontrolled ones.
The Unresolved Tensions
▸ Script brittleness — UI selectors break under cosmetic changes that carry no user impact, generating alert fatigue and eroding trust in the signal.
▸ Network idealism — synthetic agents run on stable, well-provisioned infrastructure. They are constitutionally incapable of replicating a user on a congested mobile network in bad weather.
▸ The unbothered path problem — synthetic scripts cover journeys someone thought to script. Failure modes in journeys no one anticipated remain completely invisible.
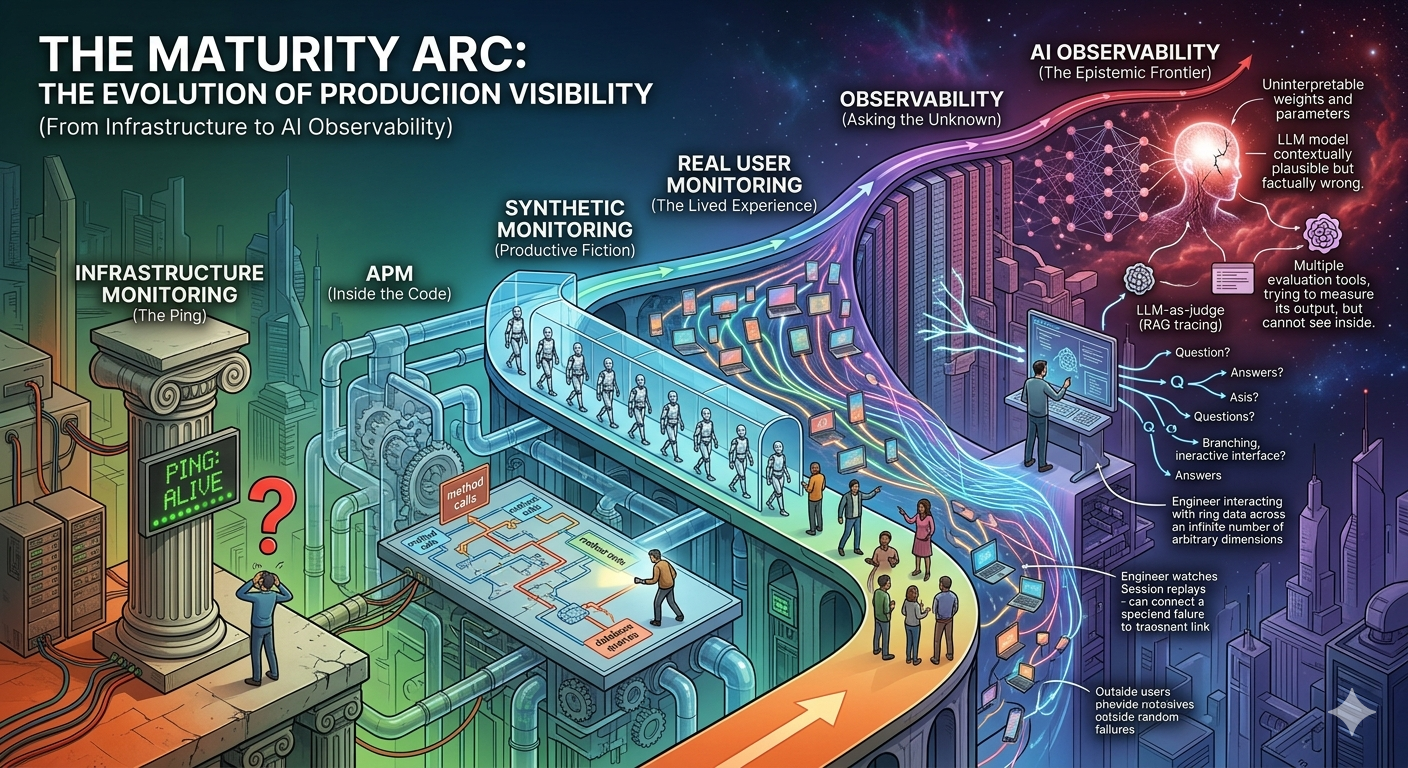
04 — Real User Monitoring
The question: What do real users actually experience?
Synthetic monitoring tells you how your application performs for an ideal user on an ideal network. Real User Monitoring tells you the truth. And the truth, it turns out, is considerably more varied and considerably more uncomfortable.
RUM works by embedding a lightweight JavaScript agent into your application that silently instruments each real user session — capturing the browser’s own timing data, recording JavaScript errors, observing navigation patterns, and reporting everything back to an analytics platform. Every user becomes an involuntary probe. The device in rural Malaysia with the four-year-old Android browser on a congested 4G connection — that is now in your data. The corporate laptop behind the TLS-inspecting enterprise proxy — that is in your data too. The user who closed the tab after seven seconds because the page hadn’t finished loading — your synthetic agent never would have detected that failure, because your synthetic agent doesn’t get impatient.
The Navigation Timing API — introduced in browsers around 2010 — was the turning point that transformed RUM from a pageview counter into a genuine performance diagnostic instrument. For the first time, the browser exposed its own internal timing breakdown in a machine-readable format: DNS lookup duration, TCP connection time, TLS handshake, time to first byte, DOM construction, render-blocking resource load, page load event. RUM agents could now capture structured, causal performance data, not inferred latency estimates.
“Core Web Vitals did something no internal engineering metric had ever achieved: it made front-end performance a number that the CFO could see in a Google Search Console dashboard and ask about at the quarterly review.”
Google’s Core Web Vitals — Largest Contentful Paint, Interaction to Next Paint, Cumulative Layout Shift — completed the transformation by translating raw performance timing into user-perception-grounded metrics with direct commercial accountability. LCP degrades → search ranking drops → organic traffic declines → revenue falls. That causal chain, made legible by Core Web Vitals, moved front-end performance from an engineering concern into a business-critical KPI.
Session replay closed the interpretive gap. When a RUM alert fires indicating elevated JavaScript error rates for a specific browser/OS combination, session replay allows an engineer to watch — not reconstruct, not infer, but watch — exactly what the affected user saw and did, rendered as a pixel-perfect DOM playback. The debugging process changes from hypothesis generation to direct observation.
The highest maturity RUM deployments propagate a W3C traceparent header from the browser’s initial request through the entire backend distributed trace, creating a continuous navigational thread between the user’s session replay and the backend span responsible for their slow experience. Click from “this user’s checkout took 11 seconds” to the exact database query that held the lock. No manual log correlation. No guesswork. One click.
The Unresolved Tensions
▸ SPA instrumentation — the browser’s Navigation Timing model assumes page navigation as the unit of measurement. React and Vue router transitions are invisible to it without custom hooks.
▸ Privacy compliance — session replay requires careful PII scrubbing and GDPR consent management. Every keystroke captured is a potential compliance liability.
▸ Signal volume — high-traffic applications generate RUM data at a scale that overwhelms naive aggregation. Meaningful segmentation requires statistical sophistication that most teams haven’t built.
05 — Observability
The question: Can I ask questions I didn’t think to pre-define?
Rudolf Kalman defined observability in 1960, in the context of control theory, as the property of a dynamic system that allows its complete internal state to be inferred from its external outputs. He was writing about electrical circuits and mechanical systems. He could not have known that sixty-four years later, software engineers would adopt his definition as the name of a paradigm shift in how they thought about production systems.
The precision of Kalman’s definition is what makes it useful and what distinguishes it from its marketing-corrupted successors. Observability is not about collecting more data. It is not about having better dashboards. It is not a synonym for monitoring with better PR. It is about designing systems such that any question about their internal state can be answered from their outputs — including questions that were not anticipated at design time. The “at design time” clause is everything.
Monitoring, by contrast, is optimized for known failures. You define the questions in advance — what thresholds matter, what conditions constitute an alert, what dimensions to aggregate — and the monitoring system answers those questions with high efficiency. It is excellent at detecting failure modes that someone has already imagined. It is structurally incapable of detecting the ones that haven’t been.
“Show me latency by database shard, segmented by tenant tier, for requests carrying the new-checkout experiment flag, on accounts that completed more than five transactions in the trailing seven days.” Pre-aggregated metrics cannot answer this. The question wasn’t written when the metric was defined. This is the problem observability exists to solve.”
The technical foundation of true observability is the handling of high-cardinality, high-dimensionality event data at query time rather than write time. A traditional metrics system pre-aggregates — it discards the individual events and retains only the summary statistics. An observability platform retains the raw events, enriched with every contextual dimension available: deployment identifier, experiment group, user tier, geographic region, feature flag state, upstream service version, customer account age. When an incident occurs, an engineer can slice across any combination of those dimensions interactively, following causal threads through the data the way a detective follows leads — not the way a dashboard operator reads gauges.
This requires a query engine with genuinely different performance characteristics: Apache Druid-style columnar storage that can execute interactive sub-second queries across petabytes of event data. The query response time is what makes the debugging workflow feel like exploration rather than waiting. Every additional second of query latency adds friction to the investigation and pushes engineers toward the dashboards they already have rather than the questions they need to ask.
OpenTelemetry functions as the lingua franca of this layer — the single instrumentation SDK that generates traces, metrics, and logs in a vendor-neutral format, decoupling the act of instrumentation from the choice of backend. The OTel Collector enables routing logic that was previously possible only through vendor-specific agent configuration: enriching spans with deployment metadata, applying tail-based sampling that preserves error traces at higher rates, routing high-priority events to separate retention tiers with different cost profiles.
The Unresolved Tensions
▸ Cost at scale — high-cardinality event retention is an order of magnitude more expensive than pre-aggregated metrics. Every dimension added to an event multiplies storage cost.
▸ Cognitive overload — the richness of data that observability enables can outpace human capacity to interpret it. More signal without better analytical tooling produces confusion, not clarity.
▸ The determinism assumption — every technique in the observability toolkit assumes that the same input to the same code produces the same output. For the next category of system, this assumption is false.
06 — AI Observability
The question: How do I debug a system that cannot be inspected?
Here is what makes AI Observability categorically different from everything that preceded it: every previous discipline was designed to observe systems that do what they are told. Precisely, deterministically, repeatably. Given the same input and the same internal state, a traditional software system produces the same output — every time, without exception. The entire intellectual apparatus of monitoring, tracing, profiling, and observability was built on this foundation of determinism.
Large language models are not deterministic. They are probability distributions over token sequences, trained on distributional patterns in training data, and they generalize from those patterns to inputs they have never seen. The same prompt, sent twice to the same model at temperature 0.7, can produce different responses. More importantly: a model trained six months ago on a static dataset is being asked questions about a world that has continued to change. Its “knowledge” decays continuously, invisibly, without any code change or deployment event that a monitoring system could detect.
“An LLM can produce an output that is syntactically coherent, stylistically confident, contextually plausible, and factually wrong. Traditional monitoring has no instrument for this failure mode. There is no error code. There is no latency spike. There is no stack trace. There is just a wrong answer, delivered at full speed with complete conviction.”
The maturity arc for AI Observability has three stages — and the industry is currently somewhere between the second and the third, still figuring out the vocabulary.
Stage I was applying existing APM to model-serving endpoints: is the inference API available? What is its p99 response latency? How many requests per second? These questions matter, but they address only the outer shell. They tell you nothing about the quality of what the model is producing inside that shell.
Stage II addressed the uniquely ML-specific failure modes: data drift and concept drift. Data drift occurs when the distribution of live production inputs diverges from the training distribution — the model is being asked questions it was never trained to answer. Concept drift occurs when the relationship between inputs and correct outputs changes in the world, causing accuracy to degrade even as the input distribution remains stable. Detecting both requires continuous statistical monitoring of feature distributions and model predictions against training-time baselines, using Kolmogorov-Smirnov tests, Population Stability Index, and Jensen-Shannon divergence. Tools like Arize AI, WhyLabs, and Evidently made this a practical workflow.
Stage III — where the generative AI revolution has forced the industry — is qualitatively different again. For a classification model, ground truth eventually arrives: the model predicted “will churn” and the customer either churned or didn’t. You can measure accuracy retrospectively. For an LLM generating open-ended natural language, there is often no ground truth. The output is not right or wrong in any computable sense — it is better or worse according to criteria that may be subjective, domain-specific, and contested.
Current LLM observability practice spans several distinct problem classes:
| Capability | What It Does | The Hard Part |
|---|---|---|
| Prompt/response logging | Records every input and output at scale | Privacy, storage cost, PII filtering at volume |
| Token cost tracking | Attributes inference cost to teams, features, users | Runaway prompts, cost anomaly detection |
| Output evaluation | Assesses toxicity, factual grounding, task quality | Requires another LLM as judge — biases compound |
| RAG pipeline tracing | Traces query → retrieval → context → response | Attribution: where in the pipeline did quality degrade? |
| Hallucination detection | Flags factually ungrounded claims | No reliable automatic metric for open-domain generation |
The toolchain is coalescing around specialized platforms — LangSmith, Langfuse, Arize Phoenix, Weave from Weights & Biases — that provide trace-level logging of the full prompt → retrieval → context → response pipeline with evaluation harnesses, token cost dashboards, and LLM-as-judge evaluation patterns. The OpenInference specification is attempting to do for LLM pipelines what OpenTelemetry did for distributed traces: define a vendor-neutral schema for span attributes covering prompt text, model name, token counts, and retrieval quality scores.
The organizational challenge is the most acute in the arc’s history. Debugging an LLM system in production does not end with a code fix. It may require prompt redesign, RAG corpus curation, evaluation dataset construction, fine-tuning data labeling, or a model version rollback — each of which involves different teams, different timelines, and different definitions of “fixed.” The production SLA has mutated: it is no longer “p99 latency under 200ms” but something like “fewer than 3% hallucinated responses in financial advice queries for enterprise-tier tenants” — simultaneously less precise and more consequential than any latency target the industry has previously attempted to operationalize.
The Open Problems — Not Engineering Gaps, But Epistemic Ones
▸ Truthfulness is not computable. How do you automatically measure factual grounding in open-domain natural language generation? No one has solved this.
▸ Causality traverses uninspectable weights. Tracing a harmful LLM output back to its origin — training data artifact, prompt design failure, retrieval gap — requires interpreting billions of parameters no human can read.
▸ SLOs require measurable outputs. Defining a meaningful SLO for a non-deterministic system whose quality degrades gradually rather than failing discretely is an open organizational problem.
▸ Evaluation is expensive. LLM-as-judge at production scale is expensive, slow, and introduces evaluator model biases into the measurement itself.
What the Arc Tells Us
Viewed end-to-end, this is not a story about technology. It is a story about the limits of human knowledge about the systems humans build — and the instruments we construct, over and over, to push those limits back.
Each discipline extended our ability to answer the question “what is happening in my system?” by one layer. Infrastructure monitoring answered it at the hardware level. APM answered it at the code level. Synthetic monitoring answered it from outside the system. RUM answered it from inside the user’s browser. Observability answered it for questions we hadn’t thought to ask. AI Observability is attempting to answer it for systems that can’t be fully understood even when you are looking directly at them.
The pattern that repeats at every transition is more important than any individual tool or technique: the instrument that solves the previous problem always creates the next problem. Better infrastructure telemetry revealed that application behavior was invisible. Better APM revealed that the client-side was invisible. Better RUM revealed that the backend causality was invisible. Better observability revealed that non-deterministic AI outputs were invisible. There is no reason to believe this cycle has completed.
The systems being built today — agentic AI pipelines, multi-model orchestration architectures, federated learning systems operating across jurisdictional boundaries — will reveal blind spots in AI Observability that practitioners cannot yet name. The next discipline in the arc has not yet been invented. It will be invented by someone who runs into a wall and decides to build a door through it.
That has always been how this works.
Infrastructure Monitoring → APM → Synthetic → RUM → Observability → AI Observability → ···
#Observability #AIObservability #MonitoringAndObservability #APM #OpenTelemetry #SRE #LLMOps #DistributedSystems #TechStrategy #SoftwareEngineering #ArtificialIntelligence #DevOps